TL;DR — A "good" direct-booking conversion rate in 2026 depends almost entirely on traffic source. Branded organic for an independent boutique converts at 4–7%. Non-branded paid search converts at 0.7–1.4%. Resort properties skew lower than urban; mobile skews 30–45% lower than desktop. If you are reading a single site-wide conversion rate without segmenting by source and device, you cannot tell whether you are good or just lucky.
This post pulls together the most useful publicly reported and aggregated conversion data for independent and boutique hotel websites, organized so you can take your own GA4 numbers and figure out where you actually sit.
How "Conversion" Is Defined in This Post
Direct-booking conversion = (completed reservations made on your site or your booking engine) ÷ (sessions). A few framing notes that change every benchmark below:
- Sessions, not users. GA4 default; matches most booking-engine analytics.
- Booking engine sessions are folded back into the parent site. If you use Mews Distributor, Cloudbeds, or SiteMinder GuestRez, you need cross-domain tracking turned on or your conversion will look catastrophically low.
- A reservation = a confirmed booking, not an inquiry or a contact-form submit. Mixing inquiry forms into your conversion number inflates it by 1.5–3×.
Benchmark 1 — Site-Wide Conversion by Property Type
Aggregated 2024–2025 reporting from booking-engine vendors (SHR, Cloudbeds, Mews) and our own client data set of ~80 independent properties:
| Property type | Bottom quartile | Median | Top quartile |
|---|---|---|---|
| Urban boutique (15–60 keys) | 1.1% | 2.2% | 3.6% |
| Resort / lifestyle (60–200 keys) | 0.6% | 1.4% | 2.5% |
| Bed & breakfast / inn (under 15 keys) | 1.8% | 3.4% | 5.5% |
| Branded select-service (independent owner, soft brand) | 1.4% | 2.6% | 4.1% |
| Vacation rental (single property direct site) | 0.9% | 1.9% | 3.2% |
The pattern: smaller, higher-intent properties convert higher. A B&B with 8 rooms gets fewer browsers and more buyers because the brand search itself qualifies the traffic. A 180-key resort fields a much wider top-of-funnel, including a lot of inspiration-stage visitors who will not book today regardless of the experience.
Benchmark 2 — Conversion by Traffic Source (Boutique, Median)
This is where most operators learn that their site-wide number is meaningless:
| Source | Median conversion | What "great" looks like |
|---|---|---|
| Direct + branded organic ("hotel name [city]") | 4.6% | 7%+ |
| Email (post-stay, newsletter, abandoned booking) | 6.2% | 9%+ |
| Branded paid search | 5.1% | 8%+ |
| Non-branded paid search | 1.0% | 2%+ |
| Metasearch (Google Hotel Ads, Trivago, Kayak) | 2.4% | 4%+ |
| Paid social (Meta, TikTok) | 0.4% | 0.9%+ |
| Organic social | 0.2% | 0.6%+ |
| Display / programmatic | 0.1% | 0.3%+ |
If your branded paid search is converting below 4%, you almost certainly have a booking-engine speed or rate-display problem, not a media problem. People typing your hotel name want to book.
Benchmark 3 — Mobile vs. Desktop
Across the boutique data set, mobile traffic is roughly 62–71% of sessions but 38–49% of bookings. Mobile conversion runs 30–45% below desktop on the same property.
| Device | Median conversion (boutique) |
|---|---|
| Desktop | 2.9% |
| Tablet | 2.1% |
| Mobile | 1.6% |
Two takeaways:
- The mobile gap is your single biggest direct-booking opportunity. Closing it from -45% to -25% on a 36-key boutique is worth more than any paid media tweak.
- The mobile gap is almost always booking-engine fault. Date pickers that shove rate detail off-screen, photo galleries that lazy-load slowly, "Book Now" buttons buried below room descriptions. Test your booking engine on a 4G connection and a 6.1" screen before you blame your conversion rate.
Benchmark 4 — New vs. Returning Visitor
| Visitor type | Median conversion |
|---|---|
| New | 1.4% |
| Returning | 4.8% |
Returning visitors convert ~3.5× higher. The implication for media spend is direct: retargeting and email re-engagement are nearly always your best CPA channels if you have first-party data — which OTA bookings actively prevent you from collecting.
Benchmark 5 — Conversion Lift From Specific Page Elements
These are A/B-tested deltas, not site-wide averages. Median lift, boutique segment, 2024–2025:
| Change | Median direct conversion lift |
|---|---|
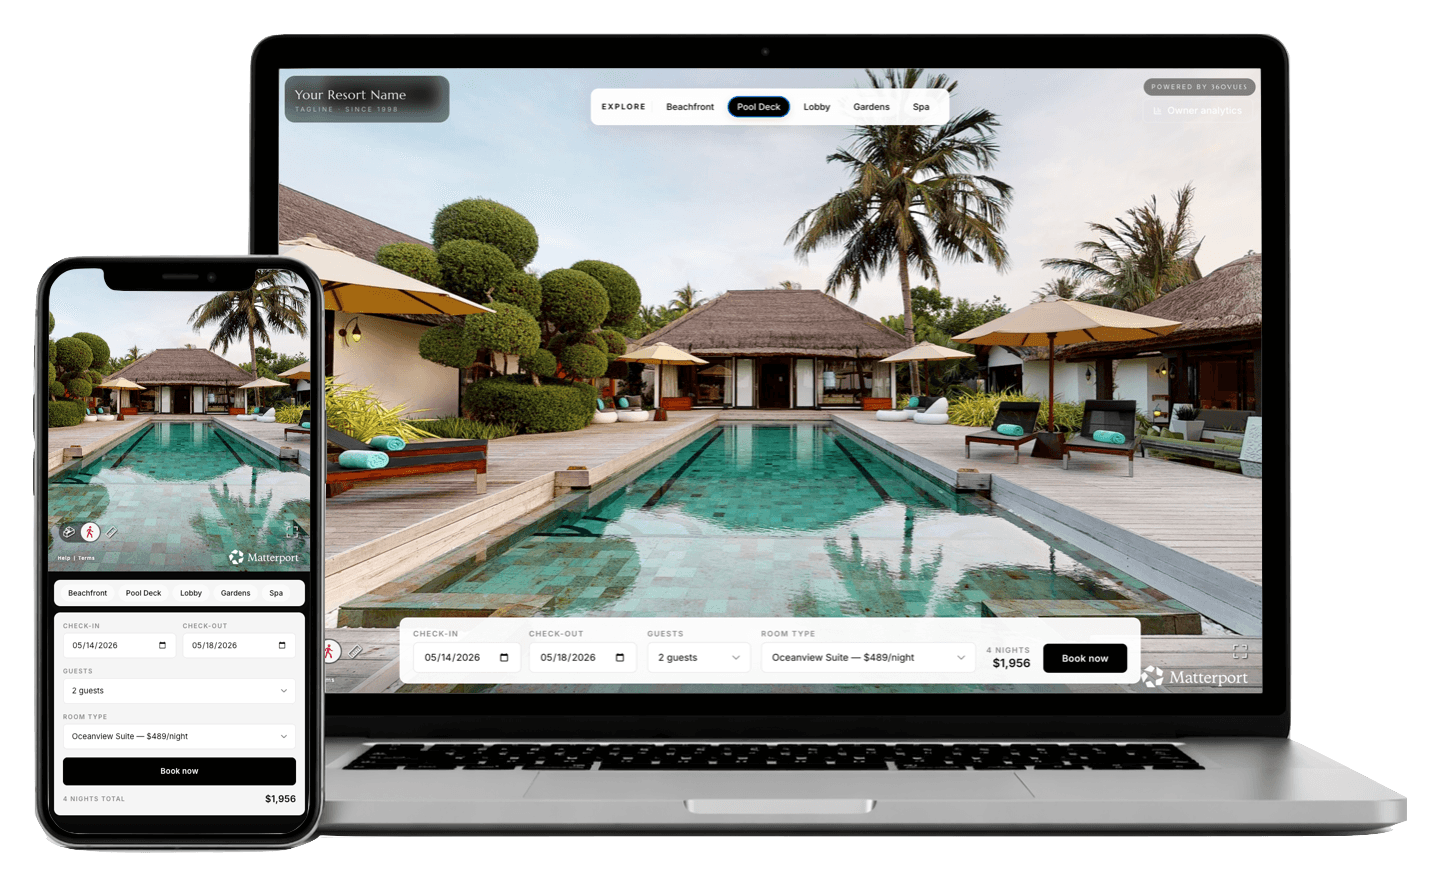
| Embedded 3D virtual tour on room detail pages | +12% to +14% |
| Above-the-fold rate display (vs. "check rates" CTA) | +7% to +11% |
| Mobile date picker reduced to 2 taps | +9% to +18% |
| Member-rate / sign-up-to-save offer | +5% to +9% |
| Price-comparison widget (vs. OTA) on booking engine | +6% to +14% |
| Real photography vs. CGI / stock | +4% to +8% |
The interesting line is the first one. Matterport's published case data and Google's "consumers 2× more likely to book after a virtual tour" both pencil out to a 12–14% direct booking lift in independent A/B tests on boutique properties. That's competitive with the entire mobile redesign in lift size, at a fraction of the engineering cost.
How to Baseline Your Own GA4
Five segments to build, in priority order:
- Branded organic + direct — anyone who knew your hotel name. This should be your highest-converting cohort. If it is not, you have a booking-engine problem.
- Non-branded paid search — your acquisition cost discipline lives here.
- Mobile + tablet — split out the mobile gap explicitly.
- Returning visitors — your retargeting opportunity surface.
- Geography matching your inbound markets — a boutique in Charleston should convert visitors from Atlanta and DC differently than visitors from Seattle.
Set the conversion event to purchase (booking engine confirmation) and not generate_lead. Cross-domain tracking on whichever booking engine subdomain you use. That's it — most operators try to instrument 30 events when 5 will do.
What "Good" Means for Your Property, Specifically
Take your own numbers and compare:
- Site-wide median below 1.4%? Probably a booking engine or mobile problem.
- Branded organic below 4%? Almost certainly a booking engine, rate-display, or trust problem (no real photography, weak imagery on room pages).
- Mobile gap worse than -45%? A specific UX redesign exercise — not a marketing problem.
- Non-branded paid search below 0.7%? Your media targeting is weaker than the property; reconsider keyword strategy or pause it.
- Email below 5%? You're not segmenting your list, or you're sending generic blasts instead of triggered post-stay flows.
The point of benchmarks is not to brag about beating them. It's to know which of your channels is dragging the average down — because that's where the next dollar of investment recovers the most revenue.
About 360VUES — Matterport 3D capture and virtual tour production. Our published client data shows a 12–14% direct booking lift on properties that embed virtual tours into room detail pages.